


Enduring Value
Exploring the relationship between private capital raised pre-IPO and company performance post-IPO.


In Silicon Valley, raising substantial private capital is almost always celebrated and perceived positively by the community. We can all picture the TechCrunch headline: “Company raises $200M at a $1B valuation” followed by accolades on LinkedIn and Twitter. And for good reason - it shows progress, allows the company to continue growing, and often comes with a higher valuation. And when it does come with a higher valuation, VCs are able to mark up their investments and employees get to see their hard work translate into wealth creation (at least on paper).
However, raising money also comes at a cost. There is dilution, possible changes to board composition & control, and a larger preference stack, amongst other things. Curiosity about those “other things” inspired me to write this post. In particular, I was curious if there were certain costs to raising more private capital pre-IPO (vs raising less). Some of the questions I wondered about were:
Does raising more private capital pre-IPO lead to a larger “enduring” public market cap?
Does raising more private capital pre-IPO lead to faster “enduring” growth?
Does raising more private capital pre-IPO lead to greater “enduring” sales efficiency?
Does raising more private capital pre-IPO lead to higher returns for investors post-IPO?
And so on. One of the dynamics I thought this analysis might tease out is what happens to the culture of a company that has ample resources to spend on compensation, customer acquisition, new initiatives, etc… Would this operating culture that is created while the company is private and well-funded become the modus operandi for the company once it's public? After all, it’s easy to turn a ski boat; it’s much harder to turn a container ship.
Company and data selection
To investigate this, I needed to focus on a set of companies. Given my interests, I focused on SaaS businesses. Next, I needed to know how much private capital companies raised pre-IPO, as well as the financial and operational metrics of these same companies post-IPO.
I gathered fundraising data from Crunchbase and financial and operational metrics from Meritech’s Public SaaS Comparables Table (amazing resource, thank you Meritech!). As of writing, Meritech’s table was most recently updated on 12/15/23, so I’m using data as of that date.
To avoid my own (selection) biases, I ran my analysis on all of the companies in Meritech’s Public SaaS Comparables Table, instead of a basket of public companies that I selected myself.
After pulling the data and merging the two datasets into a spreadsheet, I asked ChatGPT for help generating scatterplots and correlation coefficients between the amount of private capital a company raised pre-IPO and different metrics available from the Meritech data.
Private capital raised vs. enduring public market cap
First, I was curious if raising more private capital pre-IPO was correlated with a larger “enduring” market cap. By “enduring” I mean the current market cap, but I’ve chosen the word “enduring” intentionally. The enduring / current market cap is the company's value at this stage in its life, many years after its founding, and years after its IPO. Many things can impact the trajectory of a business at any time, both positively and negatively; it is this ability to endure that I find particularly interesting.
As you can see in the plot below, there is a negligible negative relationship between private capital raised pre-IPO and market cap on 12/15/23. This is shown by the red best-fit line and the Pearson Correlation Coefficient (PCC) of -0.02.
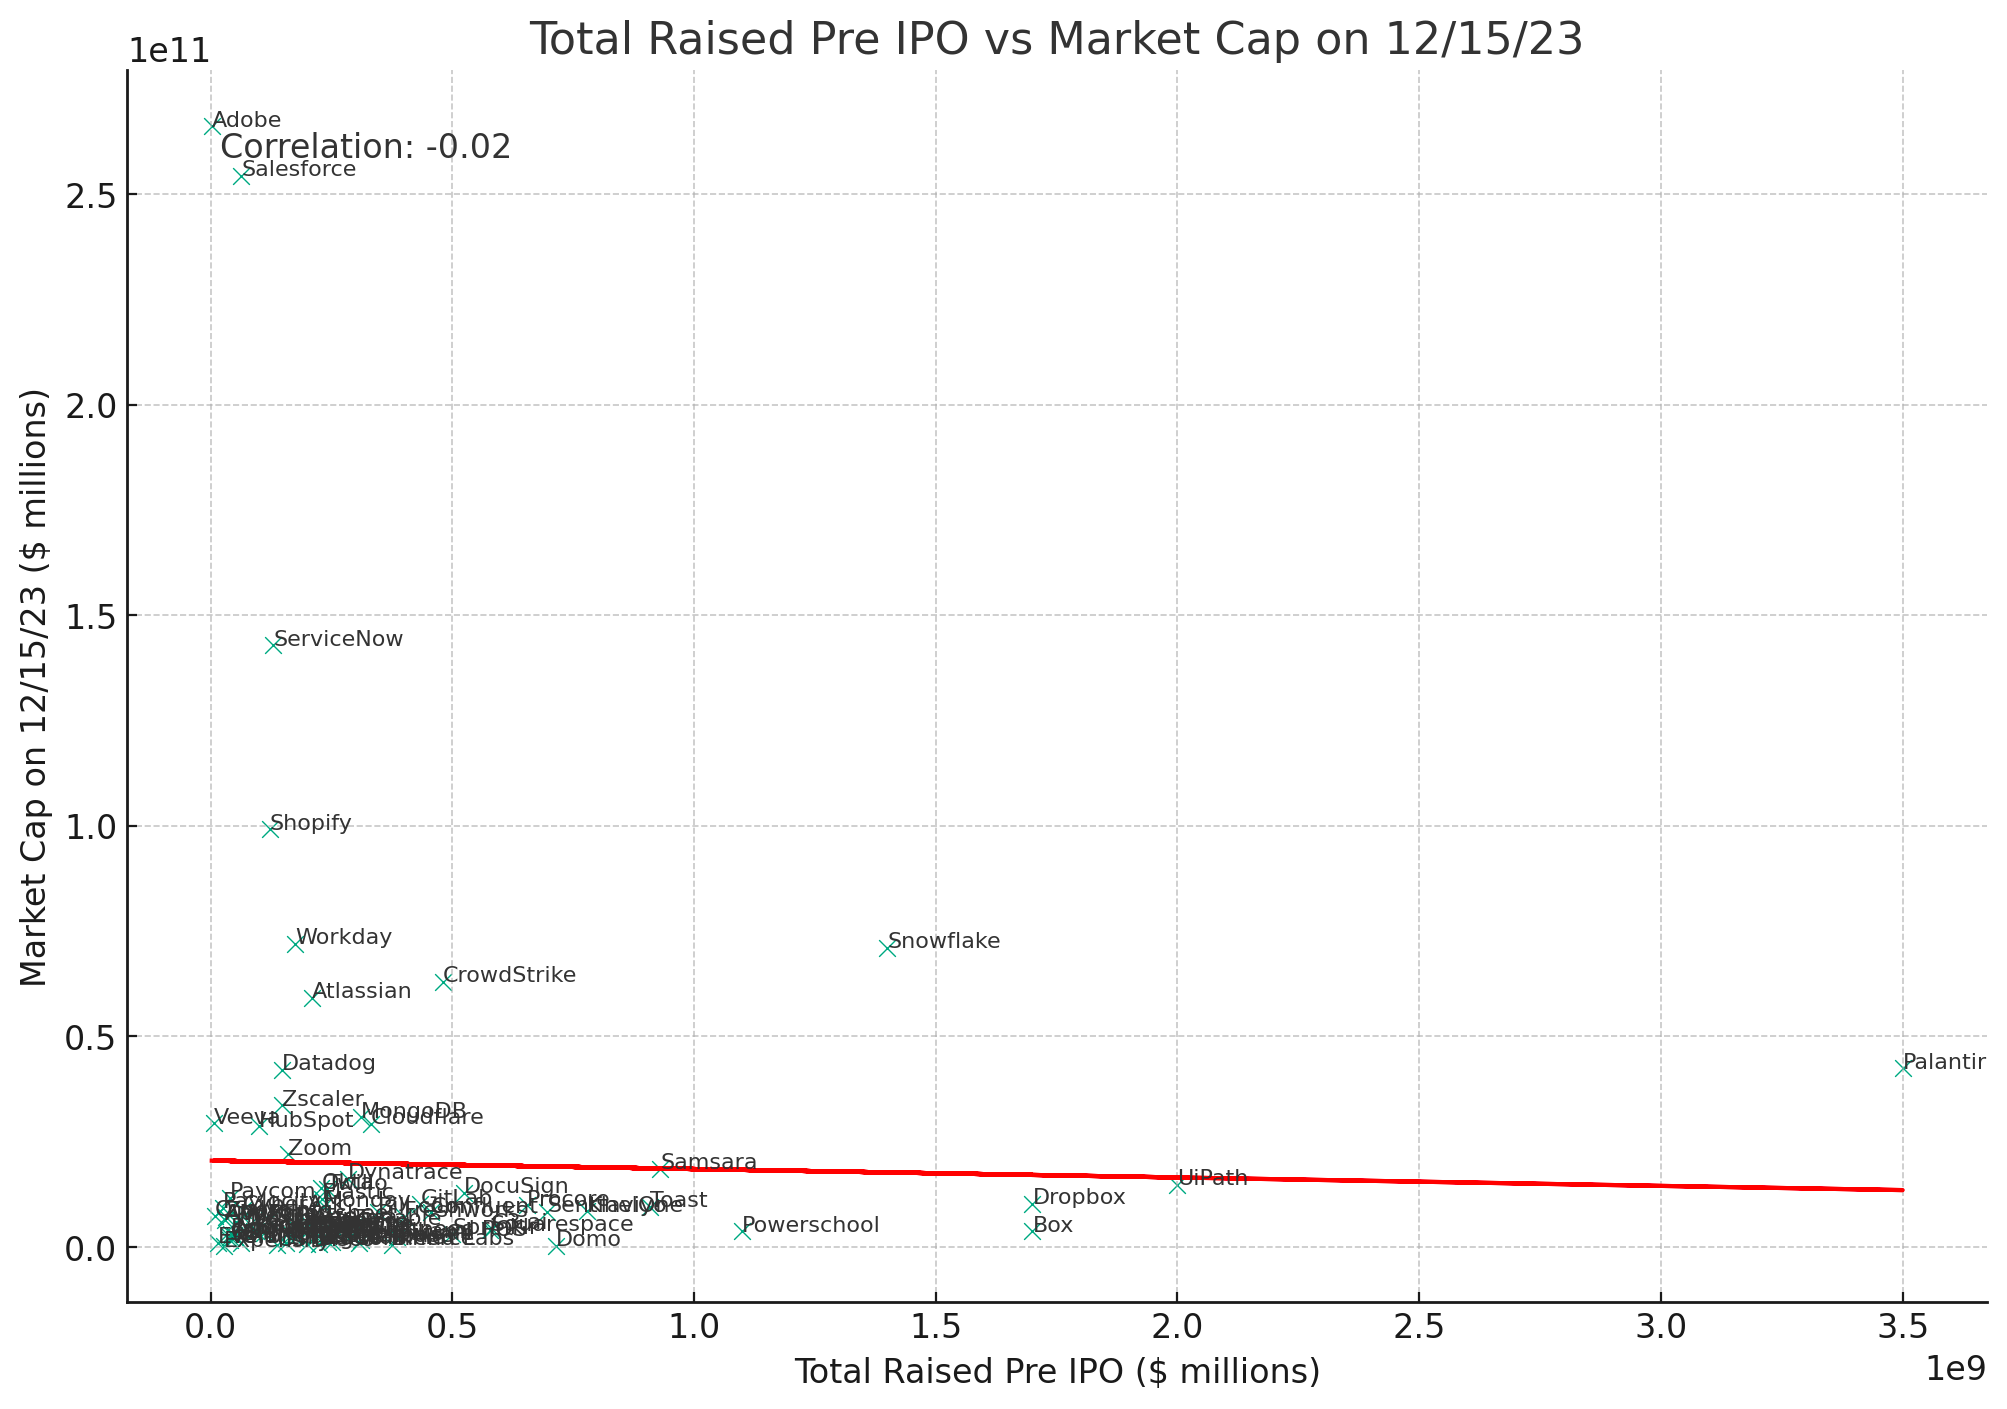
The slope of the line above is largely influenced by Adobe and Salesforce, which are fantastic businesses that have compounded for decades without having raised much money pre-IPO.
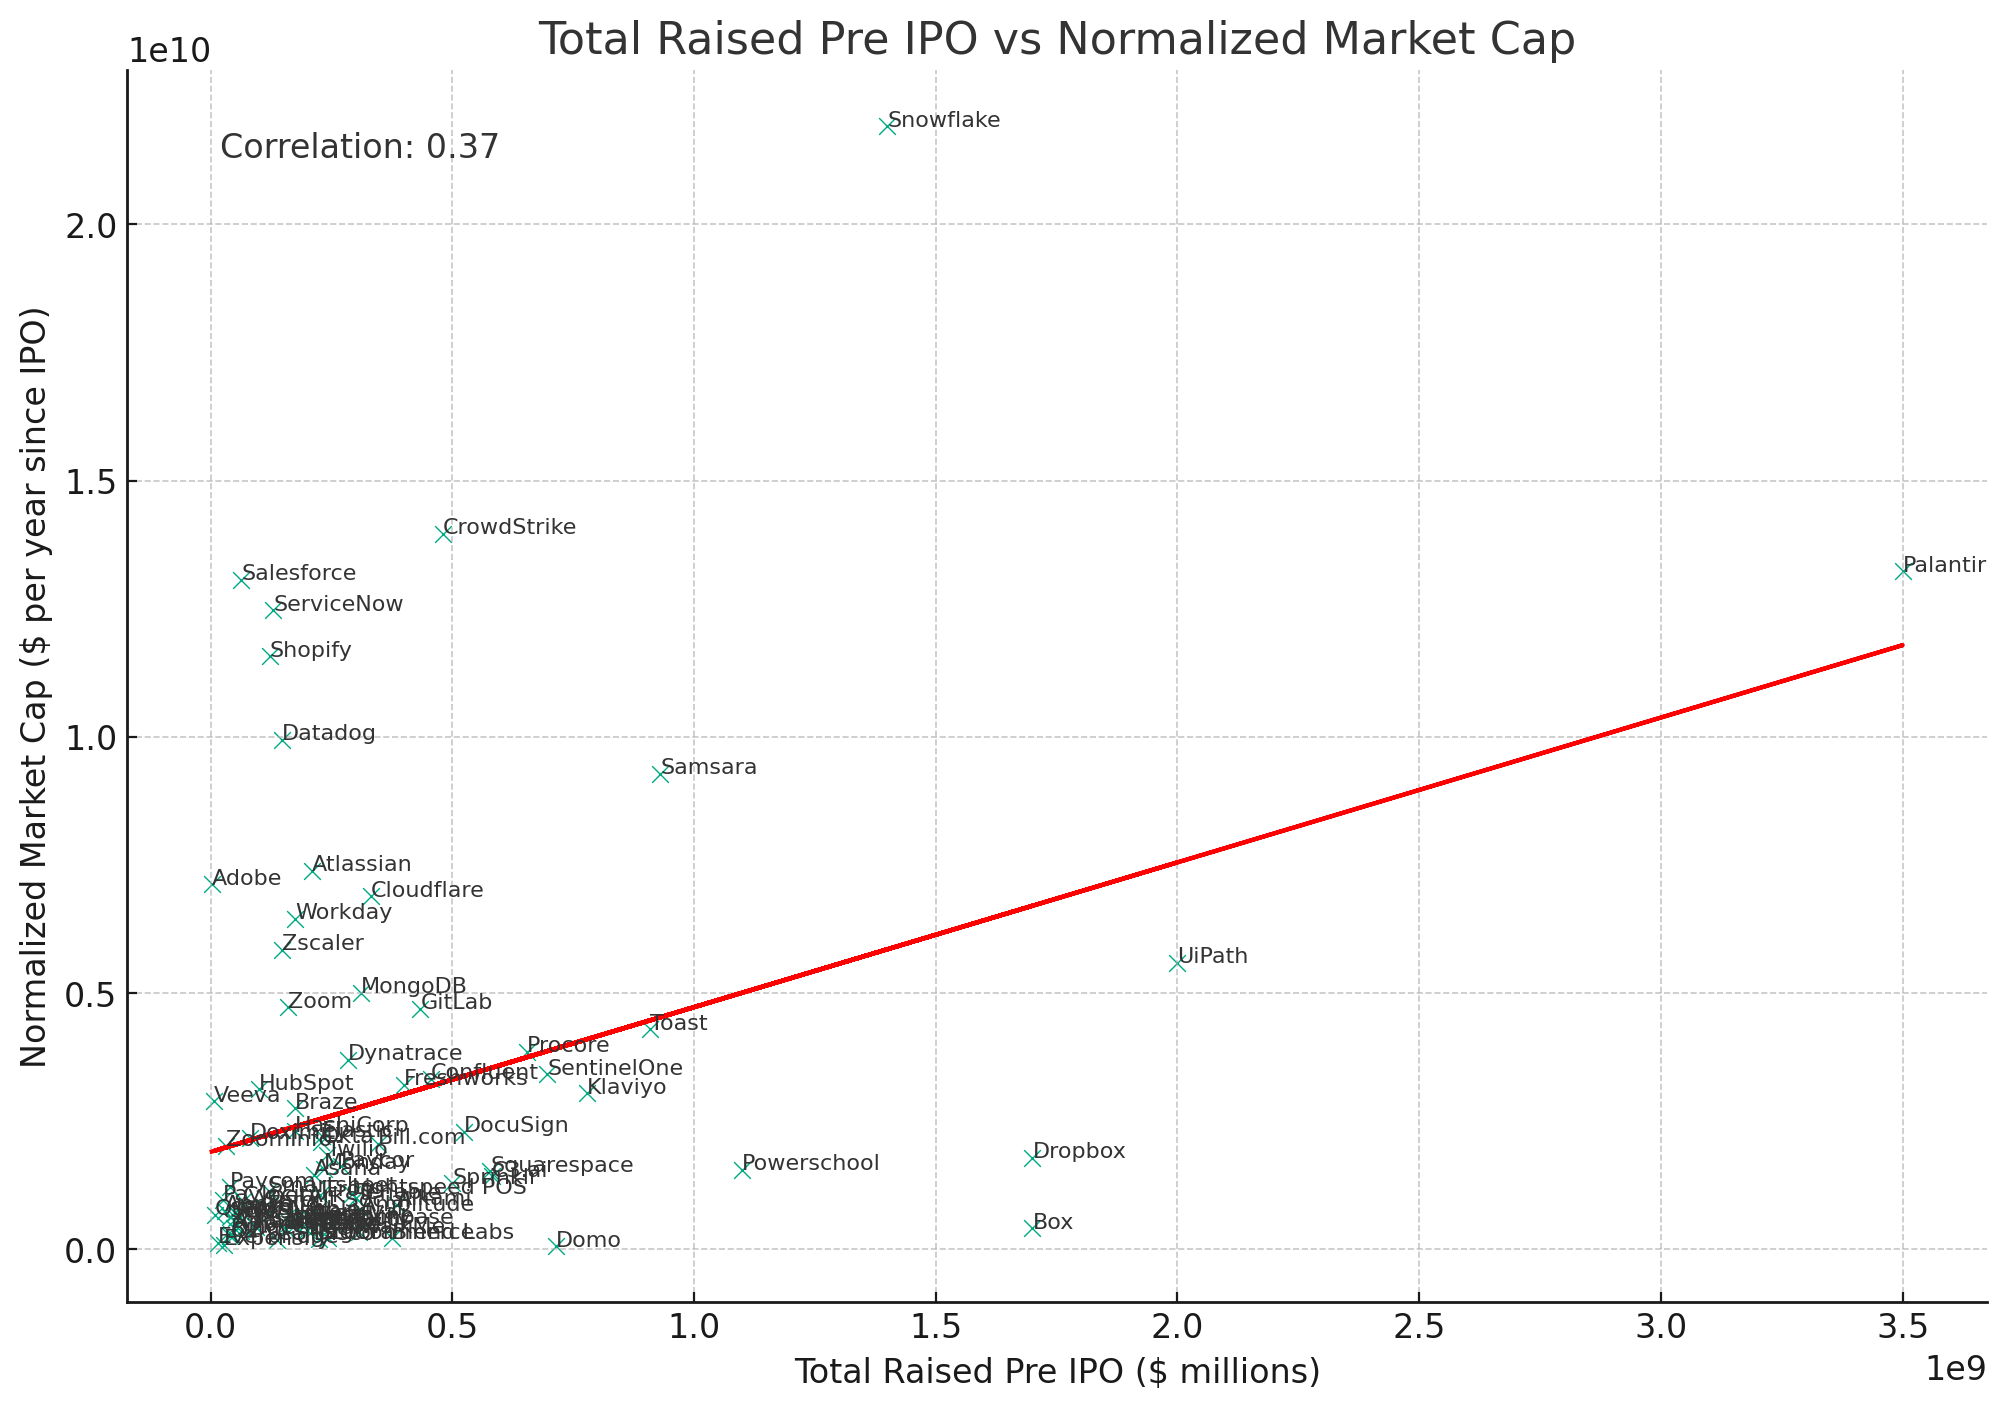
Next, I normalized the market cap by the number of days the company has been public to attempt to discount the weight of companies that have been around for longer and have thus had more time to compound. This is far from perfect - e.g. Salesforce was founded in 1999 and went public in 2004; Palantir, meanwhile, was founded in 2003 and went public in 2020. This normalization method divides Palantir’s market cap by 1,171 days, while it divides Salesforce’s by 7,114 days. (Aside - Palantir is a good example of the trend of companies staying private for longer over the last ~two decades as late-stage venture / growth capital became more available.)
Regardless, there is some merit to this method which shows a 0.37 PCC, a moderate positive relationship, between total private capital raised pre-IPO and normalized market cap.
Given that the above isn’t a perfect normalization method, I attempted one more approach, removing outliers using the interquartile range method.
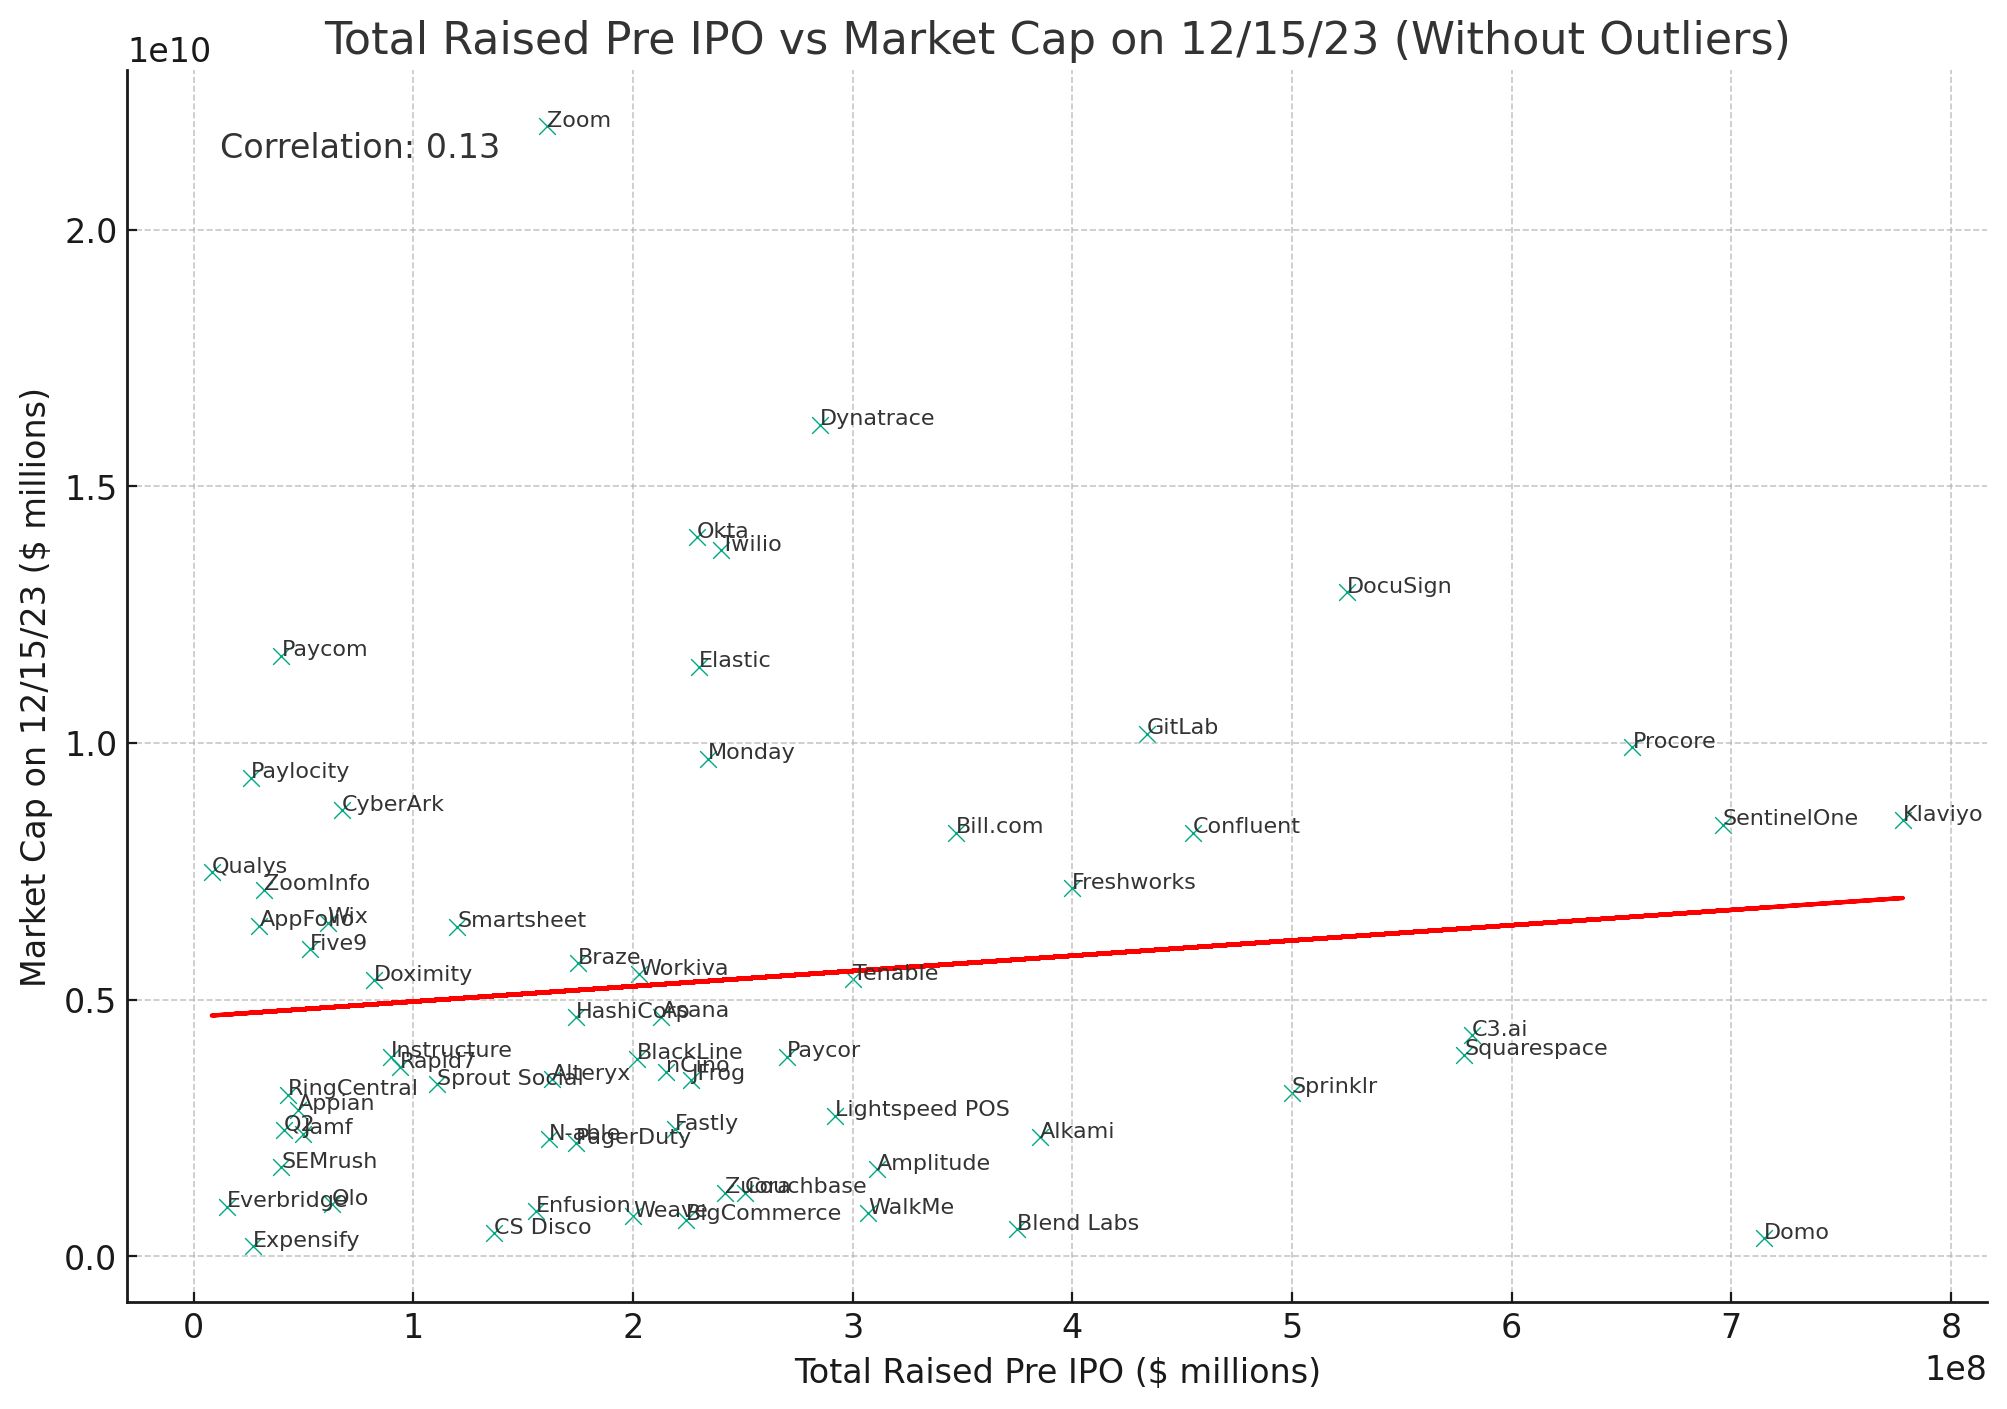
After removing outliers, we see that there is a weak positive relationship between total private capital raised pre-IPO and enduring market cap (PCC 0.13).
Looking at all three of the above charts, particularly the last two, we observe a weak / moderate positive correlation between the amount of private capital raised pre-IPO and enduring market cap, indicating that taking on additional private capital may result in additional value post-IPO.
What’s most interesting to me is that the positive relationship between the two variables isn’t nearly as strong as many would imagine. Compare Monday.com and Procore, for example. They both have roughly the same enduring market cap, though Monday.com achieved it having raised ~$250M, while Procore raised ~$650M. While generally there may be a weak positive relationship, it’s far from certain that taking on additional private capital translates into additional enduring public value.
Private capital raised vs. various financial and operational metrics
Next, I asked ChatGPT to do the same analysis above for a variety of financial and operational metrics instead of enduring market cap. See the plots below.
There are some interesting observations worth calling out from the above:
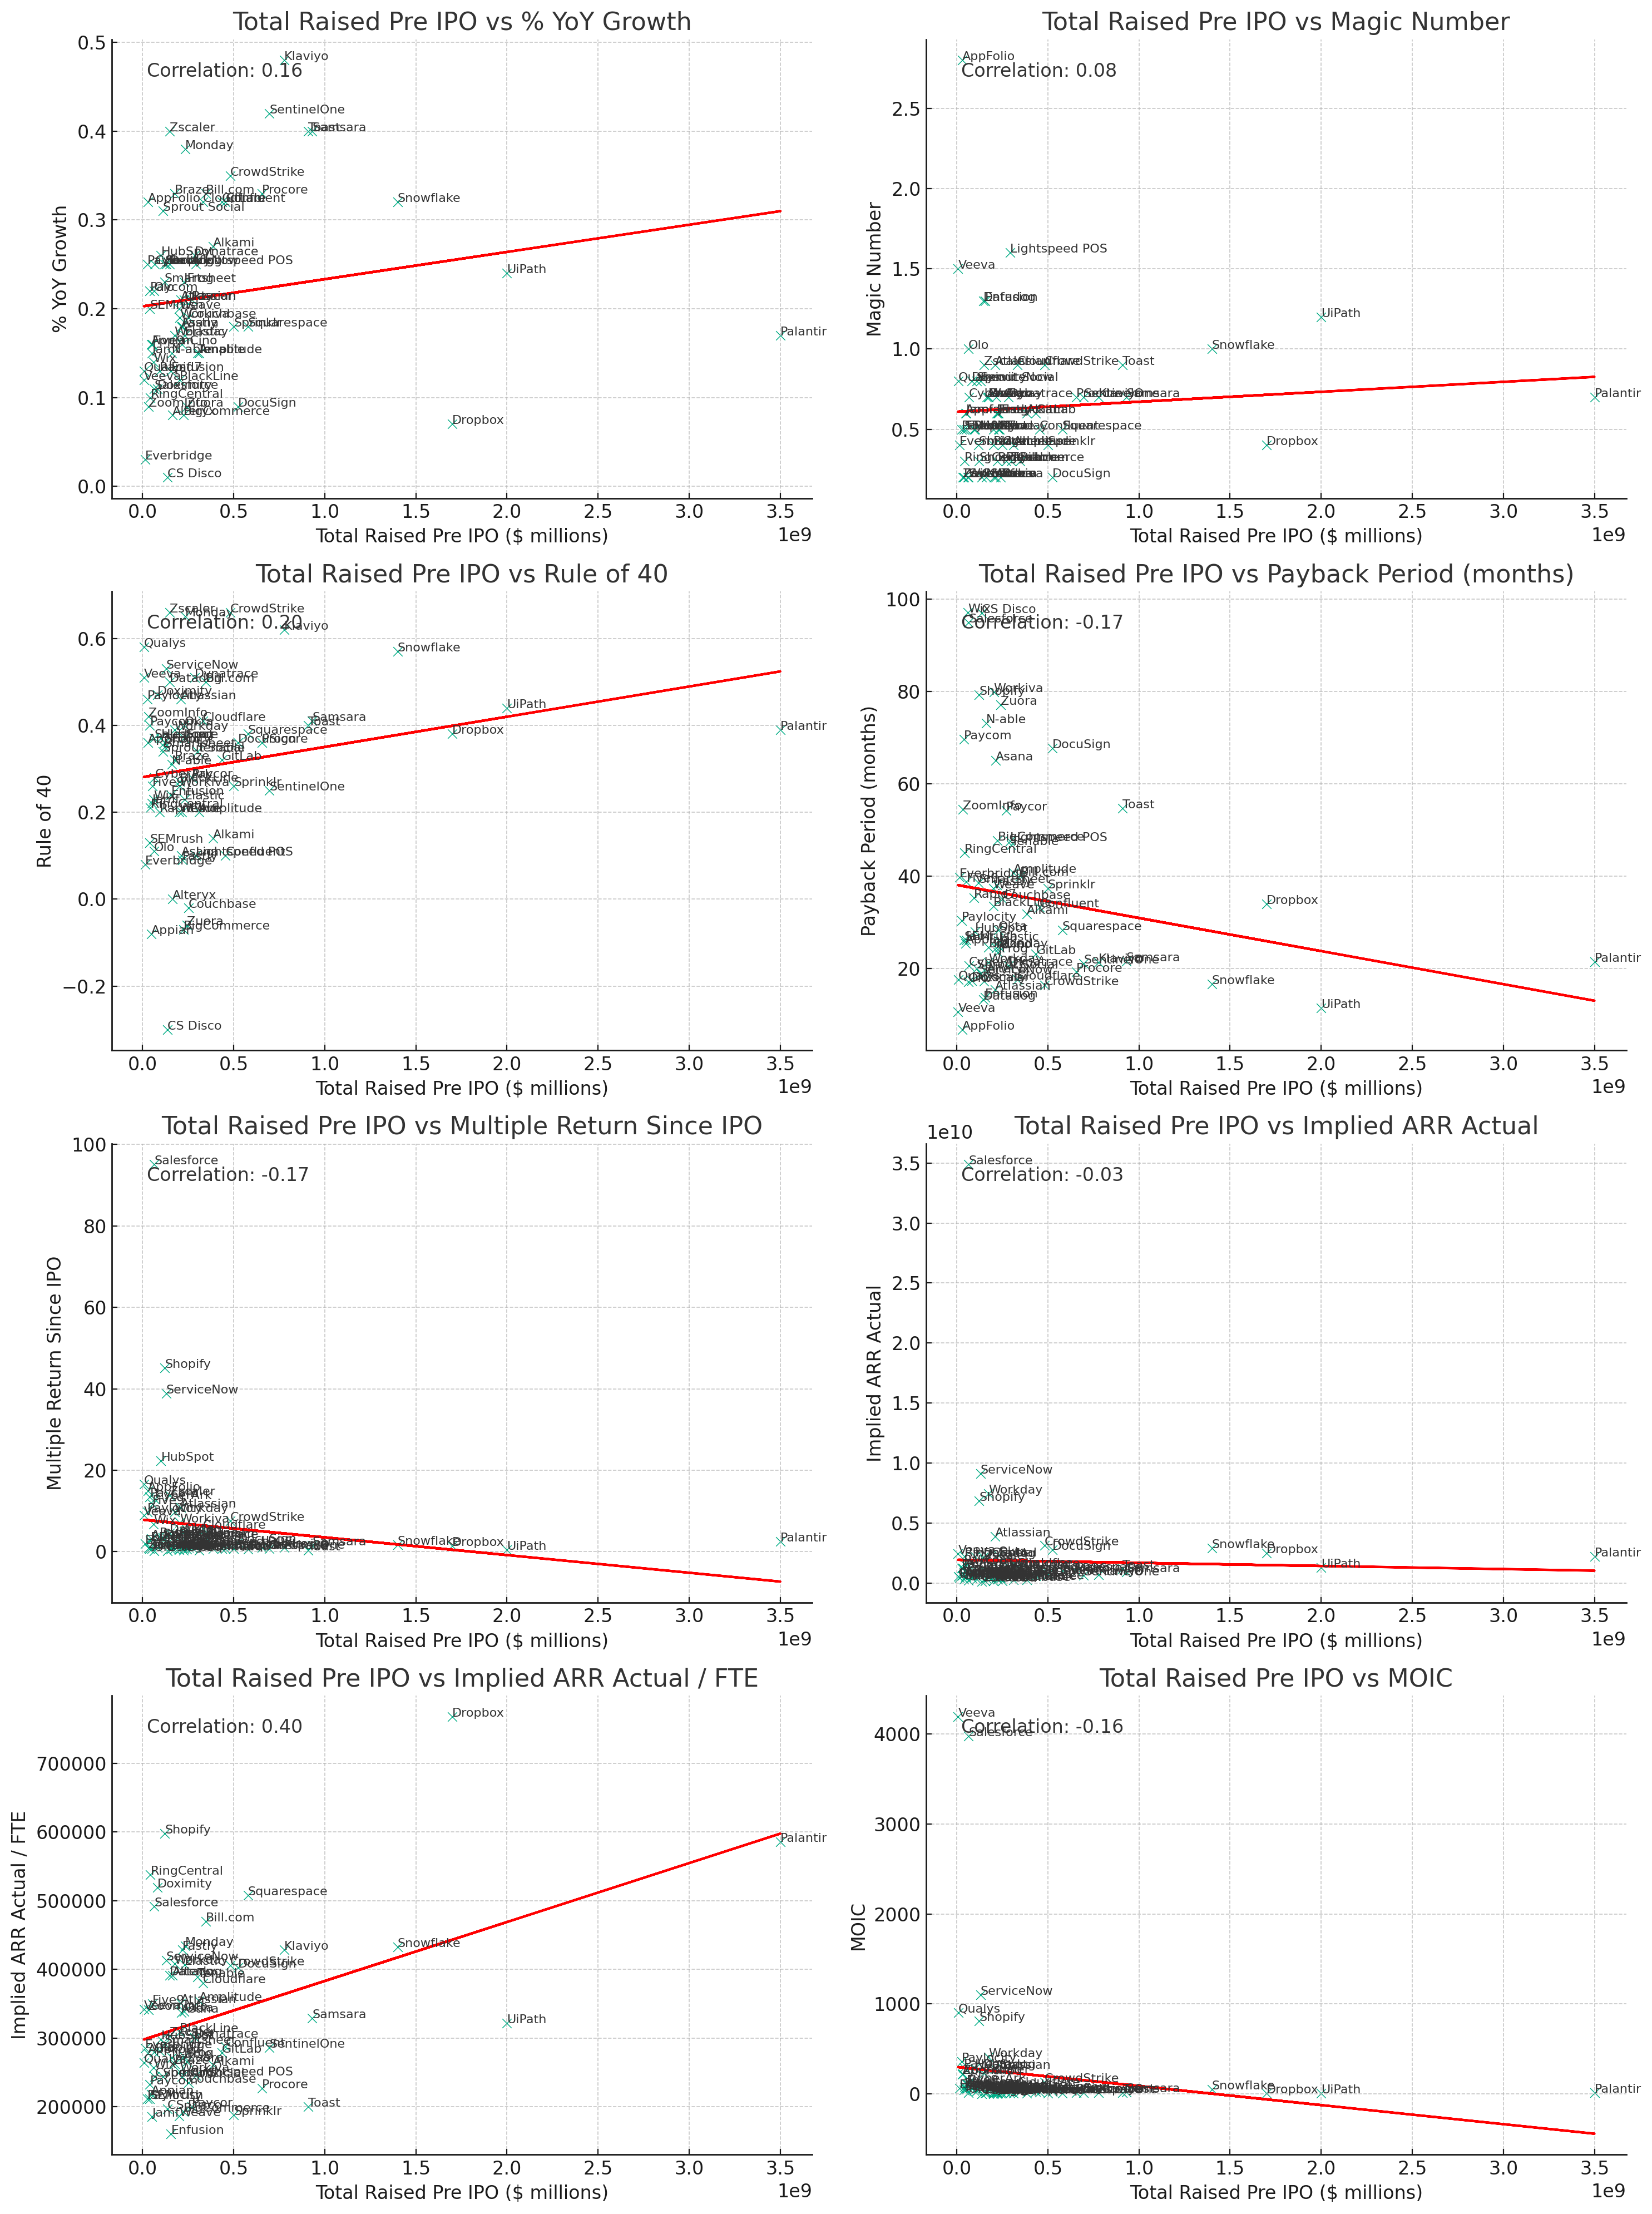
First, it appears that companies that raise more private capital pre-IPO maintain higher growth rates post-IPO, as evidenced by the weak positive relationship between private capital raised pre-IPO and YoY growth rate (PCC 0.16).
I presume that companies that take on more private capital were able to raise more capital because they were growing quickly. Once public, they continued to do so. It’s also possible that more private capital allowed for faster growth while private, which endured post-IPO. With the data available, it’s hard to draw firmer conclusions.
Second, it appears that companies that raise more private capital pre-IPO have slightly better profitability post-IPO, as evidenced by the fact that the correlation coefficient between private capital raised pre-IPO and the Rule of 40 (PCC 0.20) is stronger than the relationship between capital raised and YoY growth.
Since the Rule of 40 sums growth rate and FCF margin, this means that companies that raise more pre-IPO generate more FCF margin than those that raise less.
Third, it appears that companies that raise more private capital pre-IPO have slightly better sales efficiency as evidenced by the weak / moderate positive relationship between pre-IPO dollars raised and Payback Period (PCC -0.17, a negative value represents a positive relationship since a shorter payback is better).
Companies that raise more get paid back on their customer acquisition costs faster than those that don’t. My gut-instinct would have told me the opposite, that superfluous spending would take place where balance sheets are flush with cash. (Note that the PCC of 0.08 between capital raised and Magic Number is negligible and shows almost no relationship between the two.)
Fourth, it appears that companies that raise more private capital pre-IPO have slightly worse financial returns post-IPO, as evidenced by the weak / moderate negative relationship between private capital raised pre-IPO and Multiple Return Since IPO (PCC -0.17).
I attempted to understand the driving force behind this relationship but found it hard to isolate one likely culprit. This inverse relationship noted here could be driven by inflated private valuations that don’t square with public market investors; the fact that raising more may lead to higher private valuations, leaving less room for growth in the public markets; the idea that dollars have diminishing returns, and many other factors.
Last, it appears that companies that raise more private capital pre-IPO have higher revenue per employee post-IPO, as evidenced by the moderate positive relationship between private capital raised pre-IPO and ARR / FTE (PCC 0.40).
I would have thought that companies that raise more pre-IPO would have less efficient headcount spend as a factor of ARR than companies with less money, even years after they’ve gone public. That does not seem to be the case.
Summarizing the findings
At the beginning, I wrote the following:
Does raising more private capital pre-IPO lead to a larger “enduring” public market cap?
Does raising more private capital pre-IPO lead to faster “enduring” growth?
Does raising more private capital pre-IPO lead to greater “enduring” sales efficiency?
Does raising more private capital pre-IPO lead to higher returns for investors post-IPO?
And so on. One of the dynamics I thought this analysis might tease out is what happens to the culture of a company that has ample resources to spend on compensation, customer acquisition, new initiatives, etc… Would this operating culture that is created while the company is private and well-funded become the modus operandi for the company once it's public? After all, it’s easy to turn a ski boat; it’s much harder to turn a container ship.
After digging into the data, it indicates that:
There is a weak positive correlation between raising more private capital pre-IPO and a larger enduring public market cap.
There is a weak positive correlation between raising more private capital pre-IPO and faster enduring growth.
There is a weak / negligible positive correlation between raising more private capital pre-IPO and greater enduring sales efficiency.
There is a weak negative correlation between raising more private capital pre-IPO and higher returns for investors post-IPO.
Overall, the correlations observed here are weak and are impacted by outliers in the data. One could argue that the relationships are so weak that no meaningful insights can be drawn from this analysis. Future work could be done to adjust for outliers, potentially leading to stronger and more meaningful correlations. However, without going deeper into the data, there are some final takeaways worth mentioning.
One of the internal biases that I held leading up to this analysis was that companies with large balance sheets from large private capital raises would be full of inefficiencies. I imagined that their balance sheets would fuel faster growth, but due to the inefficiencies, there would otherwise be worse outcomes across the board, even as the companies went public.
Though the correlations are weak, the data has largely shown that to not be the case. After reflecting on it further, I believe that my initial bias probably holds for many companies that never make it to IPO. (I’d love to do that analysis, though I suspect getting ahold of the required data would be hard. Maybe some funds have run this analysis internally?)
However, going public is for the Premier League of startups - those companies that exhibit a degree of excellence and efficiency that most startups would dream of attaining. I believe that this is why we observe the (weak) positive correlations noted above between private capital raised and different measures.
In fact, the causality probably goes the other way - because these companies have such great metrics, they can raise a lot of money before they go public. And because they were excellently run while private, their cultures stick as they mature into public companies, leading to strong performance post-IPO.
These are my hypotheses, but I can’t know for certain from the data analyzed. If you have any data that supports or contrasts these findings, I’d love to hear from you. Similarly, if you’d like access to the source data to run your own analysis, I’d be happy to share - reach out.
Thanks for reading.
Erik
Massive thanks to Nicholas Hirons for reviewing this post